
To US Investors in Brazil, Your Welcome Means XP Excess Capital
XP Inc. prepares to report its Q3 2026 earnings on November 16, with investors watching for potential capital distributions from its 20.3% BIS ratio.

American retail investors holding shares of New York-listed financial platforms have their eyes on Monday, November 16, 2026, when Brazil's dominant wealth management firm XP Inc. reports its third-quarter financial results after the US market closes. Consensus revenue is projected near $1.0 billion—specifically $985.59 million according to Zacks Investment Research estimates on November 9, 2026—but the real story for shareholders is what the company plans to do with its mounting pile of excess cash.
At the heart of tomorrow's earnings call is a balance sheet that is significantly overcapitalized. According to the company's Q2 2026 financial statement released on August 17, 2026, XP’s Bank for International Settlements (BIS) capital ratio stood at 20.3%, which sits comfortably above its management-defined target range of 16% to 19%. This capital cushion gives the company substantial room to accelerate share buybacks or declare special distributions to return cash directly to the retail broker accounts of its US-based investors.
What's your name in Brazil?
For foreigners trying to navigate the Latin American financial landscape, XP Inc. is essentially the Charles Schwab of Brazil. The company operates a technology-driven investment platform that has disrupted traditional brick-and-mortar legacy banks, accumulating R$2.2 trillion (approximately $389 billion) in client assets under custody as of its August 17, 2026, financial report. While Brazilian retail markets have faced headwinds from high local interest rates—with the central bank’s Selic benchmark rate holding at 13.75% as of November 15, 2026, according to Central Bank of Brazil market data—XP’s massive cash generation has turned it into a capital-return play rather than just a growth stock.
The mechanism for this capital return is already in motion. During the first half of 2026, XP completed a R$1 billion buyback program and immediately initiated a second R$1 billion (approximately $177 million at the official central bank PTAX rate of 5.6518 reais per dollar on November 15, 2026) repurchase authorization, according to the company's Q2 2026 earnings release on August 17, 2026. Management explicitly stated during that Q2 call that they are comfortable steering the BIS ratio back toward the 16% to 19% comfort range by the end of 2026 through these capital distributions. This has placed the pace and scale of future buybacks at the absolute center of tomorrow's Q3 discussion.
Beyond the headline capital return figures, global analysts will watch how the company’s retail business navigates the high-rate environment. With Brazil's inflation tracking at a 12-month rate of 4.63% and the CDI rate hovering at 13.65% as of November 15, 2026, according to central bank economic indicators, XP has relied increasingly on corporate banking and debt capital market activity to offset squeezed retail take rates. Investors will learn if these wholesale segments were strong enough to secure the projected $0.53 earnings per share when the official figures cross the wire tomorrow evening.
In your brokerage app
US-based retail investors can track this capital distribution play directly. XP Inc. is listed on the Nasdaq exchange under the ticker symbol XP, representing the underlying operating holding company in São Paulo. The stock is also a common holding in broader Latin American financial baskets, including the iShares MSCI Brazil ETF, which offers exposed retail portfolios a direct tie to the country's shifting wealth management landscape.
Analysis · NWX analysis desk
Which Brazil assets this touches
- XP, USDBRL, DI1 — Named in this story.
- EWZ, NU, STNE — Big swings in U.S. tech stocks tend to spill into Brazil's fintechs listed in New York and into the broad Brazil fund, as global investors change how much risk they hold.
Technical picture · XP Inc. (XP)
XP Inc. (XP) closed at $15.49 on Nov 13, 2026, up 2.3% from five sessions earlier. The last close is below its 20-day average of $18.94 and below its 50-day average of $21.76. Since May 12, 2026 it has traded between $14.04 (low, Nov 2, 2026) and $32.60 (high, Oct 12, 2026).
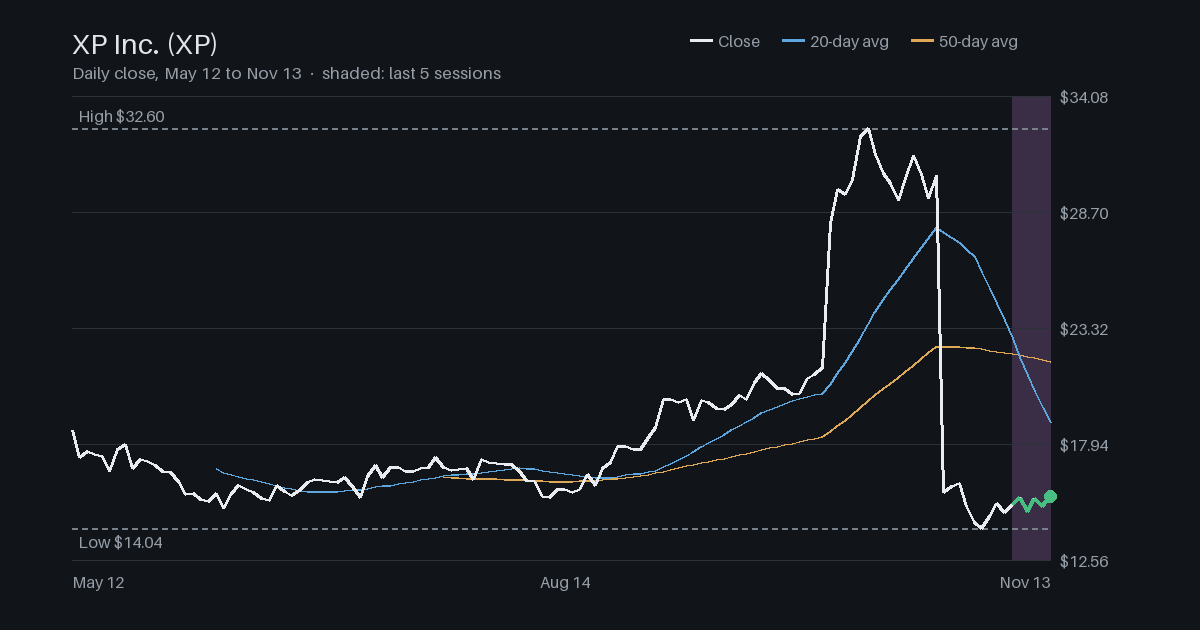
| Last close | $15.49 | Closing price on Nov 13, 2026. |
|---|---|---|
| 5-session move | +2.3% | Change in the closing price over the last five trading days. |
| 20-day average | $18.94 | The average closing price of the last 20 trading days. |
| 50-day average | $21.76 | The average closing price of the last 50 trading days. |
| Period high | $32.60 | Highest price since May 12, 2026. |
| Period low | $14.04 | Lowest price since May 12, 2026. |
Related coverage
 Why INTR is one of the few Brazil stocks trading without ADR feesInter & Co reported record Q3 2026 profits of R$ 425 million and cleared its Nasdaq-based BDR sales facility, lifting technical pressure on its shares.
 StoneCo Cuts Growth Targets, Cooling Your Welcome Brazil Fintech BetBrazilian fintech StoneCo slashed its 2026 adjusted gross profit outlook and withdrew its 2027 targets on November 12, 2026, citing soaring interest rates.